
Just for fun, but somehow it is always fun to see a rainbow.
A rainbow forms when light from the sun refracts at the surface of the raindrop, reflects from the back of it, and is refracted at the surface on the way out again, see image below.
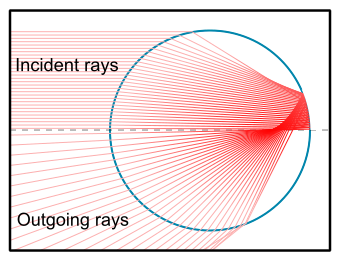
(Image from Wikipedia.org)
Most of the light comes out at 40° - 42° angle. This depends on the raindrop material (not size), rainbows formed in sea spray are smaller.
How much the light is refracted depends on wavelength (color), as the image below shows.
 (Image from Wikipedia.org)
A double rainbow forms when the light is reflected twice, as shown on the image below.
 (Image from Wikipedia.org)
The light is most intense at 50°- 53° angle, and the colors are inverted, in a reverse order compared to the main rainbow. The outer rainbow is also much fainter.


