
Image taken at 13:05 on 20 December 2010.

Image taken at 13:20 on 20 December 2010.
Very windy and lots of dust blowing around.
From the raw data, the mean was 234 micro-g/m3, and the highest value was 1369 micro-g/m3, which is close to the highest value measured this year.

 Strong north winds, and ash/dust storm seen on satellite images, especially BTD.
Last Thursday, 18 November 2010, I attended a seminar given by NIVA:
Nordic Tour 2010:
Health effects and risks of nanoparticles
This was a very interesting seminar. As perhaps expected, there were perhaps more questions raised than answered. But it was very interesting to learn about the different problems that arise when faced with a new technology, in this case, related to how to assess the health risk of nano-particles.
In general I think it is safe to say that people aren’t expecting this to be a great problem. However, some of these nano-particles do have very negative health effects. The biggest problem seems to be that the science and industry are moving very fast, but regulations and health effects are lagging way behind. Although, fortunately, many companies do not want to spend time and money to market something that could be a health risk later
It seemed that even the definition of nano-material isn’t clear yet, although defining a nano-material as having one dimension smaller than 100 nm (nano-meters, 10-9 m), seems to be the most likely outcome. However, many view particles smaller than about 1000 nm as nano.
A few examples of interesting points:
Many other interesting things were mentioned.
The homepage of Niva is http://www.niva.org/
Nano-particles are sold, it seems, without any studies of health risks, or environmental effects. See for instance, http://www.utopiasilver.com/. Don’t be tempted though ! The only real effects are seen in the video below, Blue man – drank nano-silver.
Hope I haven’t said anything wrong above, but any corrections or information about the environmental effects are welcomed.
This spring semester the course “Astrobiology” will be offered for the 3rd time.
The course is taught by scientists from astrophysics, chemistry, biology and earth science.

This topic covers many different and interesting topics, but best of all, they are fun.
Sunny and windy days now in November, in the south.

Some dust plumes visible, amongst the clouds.

Nice, clearly visible, low south of Iceland.
Images from NASA Rapidfire.
 Last Friday, 22 October 2010, I gave a talk about re-suspended material and particulate matter pollution as part of the Friday Seminar series.
Suspended material includes dust in dust storms, and ash during episodes of re-suspended ash. There are also occasions where dust and pollution travels from other countries.
It is possible to show that dust storms contribute to several days on which the health limit for PM10 pollution is exceeded. It seems that close to 1/3 can be attributed to dust storms, and this year ash has contributed to 8 of the 23 times the health limit has been exceeded.
For the past few years, it is safe to say that natural sources are responsible for about half of the days that exceed the health limit (50 micro-g/m3).
At the Engineering and Natural Sciences Research Symposium 2010 (R-VoN) 8 - 9 October I, in collaboration with Hróbjart, Inga and Hrund at the Icelandic Met Office, have a poster where we show the progress we have made in using satellite data to detect ash and eruptions/fires.
Inga and Hrund were summer-students at the IMO, great workers, through a project funded by the “Nýsköpunarsjóður Námsmanna” (Icelandic Centre for Research (RANNIS)).
Click the image for a larger size.

For more information, please contact Throstur.
 California Watch (blog) | Are dust, smoke and diesel exhaust really killing 9200 people a year? Less than the width of a human hair, fine particulate matter from smoke, dust, coal and diesel exhaust are so small they slip through the lungs and into the ... " |

Strong northerly winds, and rather dry conditions, meant that a lot of dust (and ash) was blowing out over the ocean on 15 September 2010.
The images above are from 13:20 (left column) and 15:00 (right column). Notice the little cloud that settles over Mýrdalsjökull (in the center on the south coast).
It is also interesting to note that the surface of the ablation zone seems to be completely free of ash. Since all snow accumulation melts away, we are left with a bare ice surface of which the ash washes away during rain and with melt water.

Just for fun, but somehow it is always fun to see a rainbow.
A rainbow forms when light from the sun refracts at the surface of the raindrop, reflects from the back of it, and is refracted at the surface on the way out again, see image below.
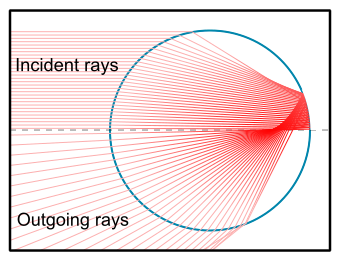
(Image from Wikipedia.org)
Most of the light comes out at 40° - 42° angle. This depends on the raindrop material (not size), rainbows formed in sea spray are smaller.
How much the light is refracted depends on wavelength (color), as the image below shows.
 (Image from Wikipedia.org)
A double rainbow forms when the light is reflected twice, as shown on the image below.
 (Image from Wikipedia.org)
The light is most intense at 50°- 53° angle, and the colors are inverted, in a reverse order compared to the main rainbow. The outer rainbow is also much fainter.
Levels of PM10 reached over 500 micro-g/m3 in Reykjavik (GRE station) today.
This affected the view considerably.

The view in Mosfellsbæ on 7. september 2010, around 18:00. Still a lot of particulate matter (PM) in the air, giving the appearance of a dense fog.
Measurements show the reason for the bad visibility.

High levels of PM10 and PM2.5 were measured in the Reykjavik area, as the plot above shows.
Quite windy at Tindfjöll, near Eyjafjallajökull, and blowing to the east (towards Reykjavík area).

Even worse air quality in Akureyri (due to dust storm, and possibly some ash).

The levels in Akureyri reached over 1200 micro-g/m3 for a short time yesterday.
Sunny day, with some wind, means re-suspended ash and dust storms.
North of Dyngjujökull (north-west part of Vatnajökull) we can probably see a small dust storm.
And in the south re-suspended ash is blowing to the west-north-west from the Eyjafjallajökull eruption zone, although clouds make observations difficult.

Image from MIRAVI – Meris ESA, taken at 12:12 on 7 September 2010.
Zooming in on the southern part of the country:

Similar image from MODIS NASA Rapidfire, taken at 12:15 on 7 September 2010.
The PM10 concentration in Reykjavik rose around noon, reached about 206 micro-g/m3 around 16 (at FHG in Reykjavik), but seems to be on the way down again (although that might change).
It is a difficult task to estimate the mass loss of the large ice sheets, Greenland and West Antarctica.
Recent modeling, where isostacy due to load changes is incorporated (in a better way than before) change these estimate greatly.
For the period of GRACE measurements (2002 – 2008), the mass loss per year changes from earlier estimate to the new estimate as shown below:
| Earlier estimate Mass loss (Gt/a) | New estimate Mass loss (Gt/a) | |
| Greenland | 230 | 104±23 |
| West Antarctica | 132 | 64±32 |
The difference here is almost 100 Gt/a (giga-tonnes per year) for Greenland, and 40 Gt/a for West Antarctica.
This means that the large ice sheets contributed less to the rise in sea level than previously thought. The difference is ascribed to thermal expansion (at least for now).
Details can be seen in the article by Wu et al. (2010) in Nature Geoscience (needs subscription, so I have only seen the abstract and the news about the results): http://www.nature.com/ngeo/journal/v3/n9/full/ngeo938.html
Then we just need to wait and see whether new models change these numbers even further, and in which direction :-)
High levels of PM10 are now measured in Reykjavik.
Strong winds from SE carry re-suspended ash, and probably sandur, towards Reykjavik.
At the background station FHG in Reykjavik, level up to 350 micro-g/m3 (30-min average) were measured just before noon.
 |
| From Summer 2010 |
In the linked album there are 3 other pictures, showing the Strokkur geysir before and during eruption. There you will also find pictures from Thingvellir, and birds and flowers that I took this summer.
Geysir activity – how/why geysir erupts
Geyser activity, like all hot spring activity, is caused by surface water gradually seeping down through the ground until it meets rock heated by magma.
The geothermally heated water then rises back toward the surface by convection through porous and fractured rock.
Geysers differ from non-eruptive hot springs in their subterranean structure; many consist of a small vent at the surface connected to one, or more, narrow tubes that lead to underground reservoirs of water.
As the geyser fills, the water at the top of the column cools off, but because of the narrowness of the channel, convective cooling of the water in the reservoir is
impossible.
The cooler water above presses down on the hotter water beneath, not unlike the lid of a pressure cooker, allowing the water in the reservoir to become superheated, that is, to remain liquid at temperatures well above the boiling point.
Ultimately, the temperatures near the bottom of the geyser rise to a point where boiling begins; steam bubbles rise to the top of the column. As they burst through the geyser’s vent, see Figure in album, some water overflows or splashes out, reducing the weight of the column and thus the pressure on the water underneath. With this release of pressure, the superheated water flashes into steam, boiling violently
throughout the column, see Figure above and in album.
The resulting froth of expanding steam and hot water then sprays out of the geyser.
Eventually the water remaining in the geyser cools back to below the boiling point and the eruption ends; heated groundwater begins seeping back into the reservoir, and the whole cycle begins again.
The duration of eruptions and time between successive eruptions vary greatly from geyser to geyser; Strokkur in Iceland erupts for a few seconds every few minutes, while Grand Geyser in the USA erupts for up to 10 minutes every 8-12 hours.


Daily average quite high at Vik on 17 July 2010, good at Hvolsvöllur and not measured at Raufarfell (broken instrument possibly).

Quite a lot of PM10 at Raufarfell on 16 July 2010, close to 300 micro-g/m3 the 24-h average, while at Vík it was close to 70 micro-g/m3, but at Hvolsvöllur it was good, just around 10 micro-g/m3.
Soon after midnight on 17 July there is a large, and sudden, increase in PM10 at Vik, so we expect higher average for 17 July than the day before.

This increase is probably due to increased wind speed in the surrounding area, or higher in the atmosphere (top of Eyjafjallajökull), since no increase was measured in wind speed at Vik.


Measurements of PM10 at Raufarfell (red lines) and Hvolsvöll (blue line). Also shown wind speed (WS) and relative humidity (RH) at Raufarfell.
Rain in the area on 10 July, and almost no wind.
Therefore, air quality very good. Around 9 micro-g/m3 at Hvolsvöllur and 5 micro-g/m3 at Raufarfell.

Low winds made for good air quality on 9 July 2010 in the ash fallout zone. The 24-h average was just under 50 micro-g/m3 at Raufarfell, and 33 micro-g/m3 at Hvolsvöllur.
According to the new instrument at Raufarfell there was a lot of Particulate Matter in the air on 8 July 2010 (24-h average 424 micro-g/m3 and highest 10-min value1071 micro-g/m3).
Not much at Hvolsvöllur, different from the day before.
The instrument at Vik still out of order.

Looking at the measurements it seems that northerly wind directions are the most effective in increasing PM10, if the wind speed is above ~5 m/s.

Some small amount of rain in the area on 8 July, and the relative humidity at Raufarfell changed from very dry to more moist around noon.


Very high at PM10 at Hvolsvöllur (almost 350 micro-g/m3), high at Raufarfell (168 micro-g/m3), but Vík was broken.

The day started off nice enough, but then, with increasing wind speed, resuspended ash (and possibly dust) increased.

This is the wind speed at Raufarfell.

Similar as yesterday on 5. July 2010.
Expecting heavy winds today, although no increase yet at 14:30.

A little rain, no wind, yielded good air quality. Vík though a little high, but still the minimum is worrisome, never went below 48 micro-g/m3. Either lots of PM blowing around always, or instrument with a wrong lower limit.

What a difference a day makes. On 2 July the average was over 200 micro-g/m3 at Hvolsvöllur, but the following day, 3 July, it was just 12 micro-g/m3. Still similar at Vik, 77 micro-g/m3. There was some precipitation in the area that helped, and the winds were calm.

High levels of PM10 around noon at Hvolsvöllur on 2 July 2010, highest level about 1774 micro-g/m3, but more stable at Vík (between 40 and 115 micro-g/m3).
Actually it never goes below 40 micro-g/m3 at Vík, which raises some concern.

The instrument at Heimaland seems to have given up completely, either due to the load on 1 July, or perhaps even those measurements were in error ?


Very high levels of PM10 at Heimaland (631 micro-g/m3), high at Hvolsvöllur (224 micro-g/m3), but quite good at Vík (58 micro-g/m3) the 24-hour averages. Health limit as before 50 micro-g/m3.

Measured PM over the day on 1 July 2010. Quite windy from about 6 in the morning, and not wet enough at Heimaland.
For Heimaland I show both the PM10 values (red solid line), and the PM2.5 values (red dashed line). It is confusing that PM2.5 values are higher than PM10, since PM2.5 are included in the PM10 category. So, either some error in PM2.5 measurements, or PM10 is underestimated (quite badly).
